Cardioid string art with generativepy
Categories: generativepy generative art
In this article we will look at how to create an image like this using Python and generativepy:

Making a cardioid curve
This type of curve is often created using pins and string, but it can be done by drawing lines on a computer image.
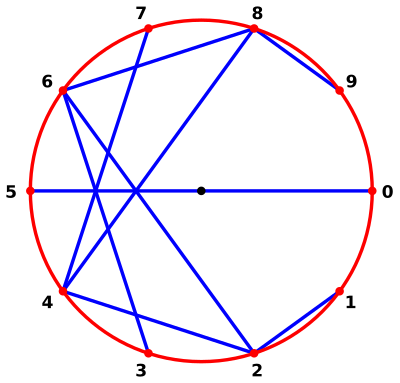
We start out with a set of points distributed equally around the circumference of a circle:
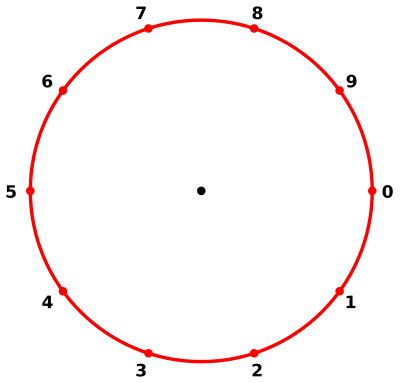
In this case we have 10 points, but in the image at the start of this post there are 200 points.
We will assume that the points are on a circle of radius 1 unit, with its centre at the point (0, 0). The (x, y) coordinates of point i are given by:
a = i*2*math.pi/N
x = math.cos(a)
y = math.sin(a)
N is the total number of points (10 in this case). a is the angle of the point around the circle, measured in radians. The points are numbered 0 to 9.
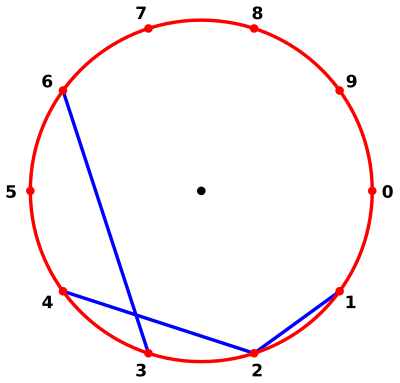
To create the image, we simply draw a line from each point i to the point 2*i. So:
- Point 0 is connected to point 0 (the line has zero length so it isn't drawn)
- Point 1 is connected to point 2
- Point 2 is connected to point 4
- Point 3 is connected to point 6
These 3 lines are shown here:
We then continue, filling in the rest of the points. Note that when we calculate the second point, we use modulo N, so:
- Point 5 is connected to point 0 (10, modulo 10)
- Point 6 is connected to point 2 (12, modulo 10)
- Point 7 is connected to point 4 (14, modulo 10)
- and so on
Here is the complete drawing. You can see the basic shape but it doesn't look much like a cardioid curve yet:
The full shape will be apparent when we add a lot more lines.
Drawing a cardioid image - the code
To draw the cardioid image, we first need to calculate the points. We will use 400 points, equally spaced around a unit circle. The equation was given above, we just need to convert this to Python code.
We will store each point as an (x, y) tuple, and place all the tuples in an array points. Here is the code:
N = 400

points = [(math.cos(i*2*math.pi/N), math.sin(i*2*math.pi/N)) for i in range(N)]
If you are not familiar with list comprehensions you can read about them here. Here is the equivalent code using a loop - it does the same thing, more verbosely, use whichever you prefer:
N = 200

points = []
for i in range(N):
    x = (math.cos(i*2*math.pi/N)
    y = math.sin(i*2*math.pi/N))
    point = (x, y)
    points.append(point)
Next, we need to produce a set of lines joining point[i] to point[i*2] (modulo N):
for i in range(N):
    j = (i*2) % N
    Line(ctx).of_start_end(points[i], points[j]).stroke(color, .005)
(This requires Python 3.5 or later, because it uses the extended unpacking syntax in PEP 448).
The code need to be placed in our draw function. Here is the full code:
from generativepy.drawing import make_image, setup
from generativepy.color import Color
from generativepy.geometry import Line
import math

N = 400

def draw(ctx, width, height, frame_no, frame_count):

    setup(ctx, width, height, startx=-1.1, starty=-1.1,
          width=2.2, background=Color(0.25))

    points = [(math.cos(i*2*math.pi/N), math.sin(i*2*math.pi/N))
                  for i in range(N)]
    color = Color(0.6, 0.6, 1, 0.25)

    for i in range(N):
        j = (i*2) % N
        Line(ctx).of_start_end(points[i], points[j]).stroke(color, .005)

make_image("cardioid.png", draw, 800, 800)
There is one final touch you might have noticed. The stroke colour is set to (0.6, 0.6, 1, 0.25). This is a light blue, but the fourth values makes the colour transparent. It has 25% opacity (ie it is 75% transparent). This means that where the lines overlap around the border of the cardioid shape, the colour looks brighter.
Join the GraphicMaths/PythonInformer Newsletter
Sign up using this form to receive an email when new content is added to the graphpicmaths or pythoninformer websites:

Popular tags
2d arrays abstract data type and angle animation arc array arrays bar chart bar style behavioural pattern bezier curve built-in function callable object chain circle classes close closure cmyk colour combinations comparison operator context context manager conversion count creational pattern data science data types decorator design pattern device space dictionary drawing duck typing efficiency ellipse else encryption enumerate fill filter for loop formula function function composition function plot functools game development generativepy tutorial generator geometry gif global variable greyscale higher order function hsl html image image processing imagesurface immutable object in operator index inner function input installing integer iter iterable iterator itertools join l system lambda function latex len lerp line line plot line style linear gradient linspace list list comprehension logical operator lru_cache magic method mandelbrot mandelbrot set map marker style matplotlib monad mutability named parameter numeric python numpy object open operator optimisation optional parameter or pandas path pattern permutations pie chart pil pillow polygon pong positional parameter print product programming paradigms programming techniques pure function python standard library range recipes rectangle recursion regular polygon repeat rgb rotation roundrect scaling scatter plot scipy sector segment sequence setup shape singleton slicing sound spirograph sprite square str stream string stroke structural pattern symmetric encryption template tex text tinkerbell fractal transform translation transparency triangle truthy value tuple turtle unpacking user space vectorisation webserver website while loop zip zip_longest