L Systems and Koch curves
Categories: generativepy generative art
In this article we will look some simple L Systems and how they can be used to create fractal images in generativepy. We will make use of the simple turtle system provided by generativepy.
A simple L System - algae
To define an L System, we first define the alphabet (or set of symbols) it uses. To keep things simple, we will use an alphabet that consists of just two letters, A and B.
We then have to define a set of rules. The rules are used to transform a string of symbols into a different string. In an L System, there is one rule for each symbol, and it determines how that symbol is transformed. The tow rules we will use are:
A becomes B
B becomes BA
Finally we define our initial string, sometimes called the axiom. We will start with the string A.
Iteration 1
On each iteration we take each character in the current string, and apply the rules to create a new string.
Our current string is A, so we apply the rule A becomes B, giving us a new string B.
Iteration 2
Our current string is now B, so we apply the rule B becomes BA, giving us a new string BA.
Iteration 3
Our current string is now BA. Applying the same rules, the first character, B becomes BA and the second character A becomes B. We join these together to form the new string BAB.
Iteration 4
Our current string is now BAB. The first B becomes BA, the A becomes B, and the second B becomes BA. The new string is therefore BABBA
If you continue this, the next string will be BABBABAB, and then BABBABABBABBA and so on.
This system is meant to give a very crude model of how algae grows. One thing you might notice is that the lengths of the strings are 1, 1, 2, 3, 5, 8, 13 ... the Fibonacci series.
Algae in Python
Before attempting to draw anything, lets implement this system as a simple Python program:
AXIOM = 'A'
RULES = { 'A' : 'B',
          'B' : 'BA'}
ITERATIONS = 6


def lsystem(start, rules):
    out = ''
    for c in start:
        s = rules[c]
        out += s

    return out


s = AXIOM
print(s)
for i in range(ITERATIONS):
    s = lsystem(s, RULES)
    print(s)
We have defined our AXIOM (the initial string), and our set of RULES. The rules are implemented as a Python dictionary. For each input symbol, the dictionary supplies the string that the symbol will be replaced with.
The lsystem function accepts parameters start (the string to be converted) and rules (the rules dictionary). It loops over every character in the string, converting it via the rules dictionary, and adding it to the end of the output string.
Finally the main loop iterates 6 times, printing the output string at each stage.
Creating a drawing with an L System
So how do we use L Systems to create drawings?
A simple way is to make each letter represent an operation using the turtle graphics system mentioned above (article here). We could use:
Fto represent the turtle moving forward by a certain distance (we will call itLENGTH)+to represent the turtle turning left by a certain angle (we will call itANGLE)-to represent the turtle turning right by the same angle
Now lets set our rules:
F becomes F+F--F+F
+ becomes +
- becomes -
Symbols like + or - that are always replaced with themselves are called constants in a L System.
Our axiom (starting string) will be F, LENGTHis 1 and ANGLE is 60 degrees (pi/3 radians).
After one iteration, the initial F will be replaced with F+F--F+F. This string can be interpreted as:
- Forward 10
- Left pi/3
- Forward 1
- Right pi/3
- Right pi/3
- Forward 1
- Left pi/3
- Forward 1
This draws a shape like this:
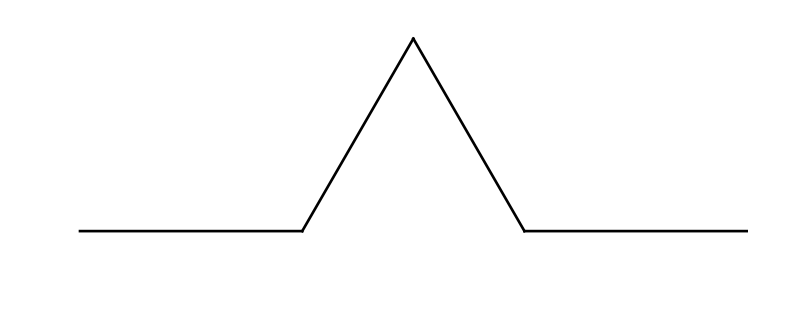
You might recognise this shape as a Koch curve. This is the basis for the standard Koch curve.
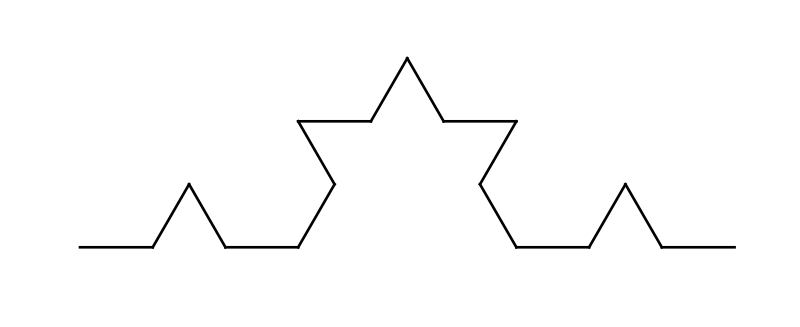
On the second iteration, each F is replaced with F+F--F+F, which means each line is replaced with the figure above. This gives F+F--F+F+F+F--F+F--F+F--F+F+F+F--F+F. Here is teh curve created:
On the 3rd and 4th iterations the string gets longer and longer. Here is what we get if we draw the curve represented by string in the 4th iteration:

There are two things to notice about this curve. The first thing is that as the number of iterations grows, the curve gets bigger and bigger. We actually rescale the image for each curve, so it fits on the page. The curve actually gets 3 times wider on each iteration, so the 4th iteration is actually 27 times bigger than the 1st iteration
If you think about it, this is also how most plants grow. They start off small and simple, and as they grow they get bigger and more complex. Since L Systems were originally invented to model plant growth, this makes sense.
The other thing to notice is that the string contains a full description of the curve. The drawing code just needs to follow the drawing instructions, one after another. The recursive nature of the shape in encoded into the string itself.
Koch curve L System in Python
Here is the Python code to draw the shape above:
from generativepy.drawing import make_image, setup
from generativepy.geometry import Turtle
from generativepy.color import Color
import math

AXIOM = 'F'
RULES = {'F': 'F+F--F+F',
         '+': '+',
         '-': '-'}
ANGLE = math.pi / 3
LENGTH = 1

ITERATIONS = 1
WIDTH = 3.6
HEIGHT = 1.4

def lsystem(start, rules):
    out = ''
    for c in start:
        s = rules[c]
        out += s

    return out


def draw(ctx, pixel_width, pixel_height, frame_no, frame_count):
    setup(ctx, pixel_width, pixel_height, startx=-WIDTH/10,
          starty=WIDTH/10-HEIGHT, width=WIDTH, background=Color(1))

    s = AXIOM
    for i in range(ITERATIONS):
        s = lsystem(s, RULES)

    turtle = Turtle(ctx)
    turtle.set_style(line_width=WIDTH/300)
    turtle.move_to(0, 0)
    for c in s:
        if c == 'F':
            turtle.forward(LENGTH)
        elif c == '+':
            turtle.left(ANGLE)
        elif c == '-':
            turtle.right(ANGLE)


make_image("lsystem-koch-curve-1.png", draw, 800, int(800*HEIGHT/WIDTH))
The lsystem function is the same as defined for the algae case, but with a different set of rules.
The draw function is a standard drawing function used in generativepy. It has three main parts.
The first part of the draw function executes the L System:
    s = AXIOM
    print(s)
    for i in range(ITERATIONS):
        s = lsystem(s, RULES)
This runs the L System ITERATIONS times, to create the final string.
The second part sets up the Turtle system. It also moves the current turtle position to the bottom left of the canvas:
    turtle = Turtle(ctx)
    turtle.set_style(line_width=WIDTH/300)
    turtle.move_to(0, 0)
 ```

Finally we loop through every character in the string created by the L System. For each character we perform the required operation:

```python
    for c in s:
        if c=='F':
            turtle.forward(LENGTH)
        elif c=='+':
            turtle.left(ANGLE)
        elif c=='-':
            turtle.right(ANGLE)
Things to try
You can try varying the number of ITERATIONS to create different levels of Koch curves like the ones shown in the diagram above. The more iterations, the bigger the image. You will need to adjust the SIZE of the image. Here are suitable parameters for generating the first few iterations, scaling the image to be 800 pixels wide in each case.
ITERATIONS = 2
WIDTH = 11
HEIGHT = 4.5
make_image("lsystem-koch-curve-2.png", draw, 800, int(800*HEIGHT/WIDTH))

ITERATIONS = 3
WIDTH = 33
HEIGHT = 12
make_image("lsystem-koch-curve-3.png", draw, 800, int(800*HEIGHT/WIDTH))

ITERATIONS = 4
WIDTH = 100
HEIGHT = 40
make_image("lsystem-koch-curve-4.png", draw, 800, int(800*HEIGHT/WIDTH))
Related articles
Join the GraphicMaths/PythonInformer Newsletter
Sign up using this form to receive an email when new content is added to the graphpicmaths or pythoninformer websites:

Popular tags
2d arrays abstract data type and angle animation arc array arrays bar chart bar style behavioural pattern bezier curve built-in function callable object chain circle classes close closure cmyk colour combinations comparison operator context context manager conversion count creational pattern data science data types decorator design pattern device space dictionary drawing duck typing efficiency ellipse else encryption enumerate fill filter for loop formula function function composition function plot functools game development generativepy tutorial generator geometry gif global variable greyscale higher order function hsl html image image processing imagesurface immutable object in operator index inner function input installing integer iter iterable iterator itertools join l system lambda function latex len lerp line line plot line style linear gradient linspace list list comprehension logical operator lru_cache magic method mandelbrot mandelbrot set map marker style matplotlib monad mutability named parameter numeric python numpy object open operator optimisation optional parameter or pandas path pattern permutations pie chart pil pillow polygon pong positional parameter print product programming paradigms programming techniques pure function python standard library range recipes rectangle recursion regular polygon repeat rgb rotation roundrect scaling scatter plot scipy sector segment sequence setup shape singleton slicing sound spirograph sprite square str stream string stroke structural pattern symmetric encryption template tex text tinkerbell fractal transform translation transparency triangle truthy value tuple turtle unpacking user space vectorisation webserver website while loop zip zip_longest